Integrating Historical and Forecast Data in Commercial Real Estate Models
At Realogic, we dedicate significant resources to creating user-friendly Excel models that address a variety of our clients’ commercial real estate needs at both the asset and portfolio levels. These models range from acquisitions, development, and fund-level returns to custom client requests for budgeting, loan pricing, and corporate models.
While much attention is given to acquisition models—such as determining the price to pay for an asset and projecting returns based on leverage scenarios—our focus today is on Actual Results or Track Records. How has an acquired asset performed based on the cash contributed and distributed? Learning from success and failure allows underwriters to improve best practices. Additionally, from an asset management perspective, understanding potential exit points and strategies is crucial for effective portfolio management.
Three Key Return Metrics in Real Estate Models Hinge on Actuals
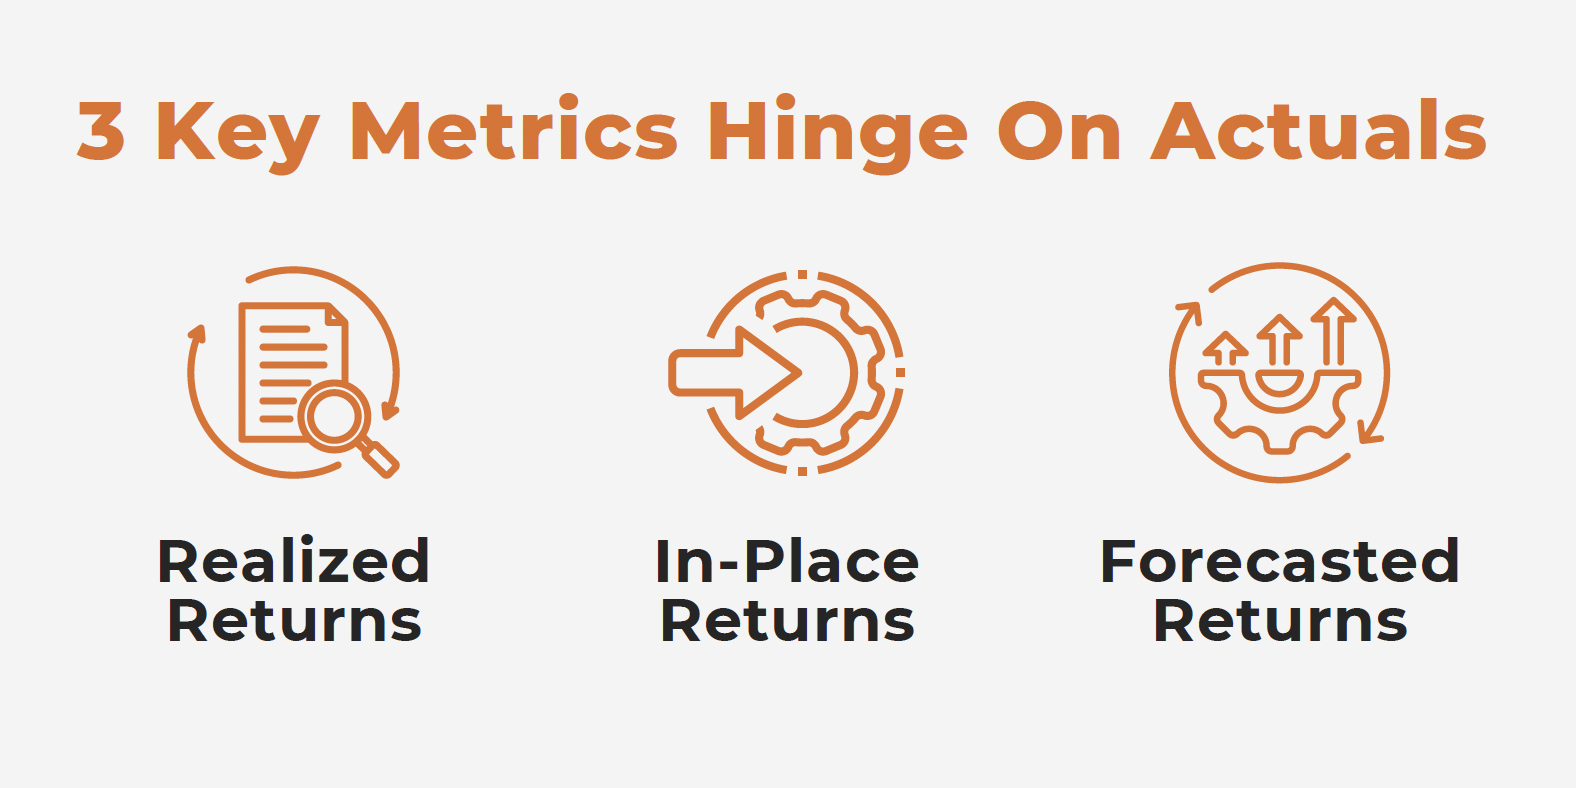
Three key return metrics all depend on the inclusion of actual results:
Realized Returns: For assets already disposed of, the actual cash contributions and distributions and the timing of each.
In-Place Returns: Actual cash contributions and distributions to date, along with a hypothetical sale at today’s hypothetical value.
Forecasted Returns: Actual cash contributions and distributions to date, paired with a hypothetical sale at a future date.
To compute and analyze these key metrics, accurate integration of both actual and forecasted data is vital for producing reliable analysis. In order to begin the integration, it’s necessary to understand where your source data derives from and the periodicity necessary to derive the most accurate results.
1. Commercial Real Estate Source Data
Source data will come from two primary locations:
- Actual Data: This is your accounting data, and it is essential to replace this data each time a model is updated to avoid errors. This is especially true if actual results are restated in periods after the financial books are closed for a given period.
- Forecasted Data: This data is generated from the underlying real estate projections to calculate future cash flow before debt service, and it can be produced by third-party discounted cash flow applications like rDCF, Argus Enterprise (“AE”), or a separate Excel model.
2. Periodicity/Granularity
Source data should ideally be gathered monthly, with actual dates for contributions and distributions. More granular data (such as monthly) allows for aggregation into quarterly or annual data but starting with annual data makes it impossible to move backward into smaller time periods. Monthly data is recommended, and if you have the exact dates for actuals, the XIRR function provides the most accurate measure for non-periodic cash flows.
Once you have determined where your source data comes from, and how granular it is, building a chart map and determining key dates is critical to a successful integration of actual and projected data.
Chart Map for Commercial Real Estate Modeling
A chart map in the context of financial modeling, especially in commercial real estate, is a tool used to organize and map financial accounts or data into a structured, coherent format. It helps ensure that data, particularly from different sources such as accounting systems or forecast models, is categorized and aggregated correctly. Here’s a deeper explanation of a chart map’s role and benefits:
Purpose of a Chart Map
1. Data Organization and Consistency:
A chart map serves as a bridge between raw financial data and the higher-level reporting or analysis you want to perform. Accounting systems often have a wide range of general ledger (GL) accounts with detailed information, and this data might not always be in the format or structure needed for modeling.
The chart map helps by categorizing multiple GL accounts into simplified, meaningful groups (e.g., income, operating expenses, capital expenses). This allows you to present data in a more digestible format for decision-making.
2. Facilitates Reporting:
When building a financial model, especially one that integrates actual results and forecasted data, you often need to roll up various detailed accounts into summary categories for easier reporting. For example, a company may have dozens of individual expense accounts (e.g., repairs, utilities, and taxes), but a chart map might combine these into a single “operating expenses” category for clearer high-level analysis.
3. Ensures Proper Sign Handling:
One challenge with integrating data from accounting systems is the use of debits and credits. In many financial models, you may need to reverse the sign of a balance for certain accounts to make the data consistent with your model’s requirements. A chart map can help by applying a simple multiplier (1 or -1) to specific data entries, ensuring correct handling of cash flows, expenses, and revenues.
Key Components of a Commercial Real Estate Chart Map
1. Account Mapping:
This component links specific GL accounts to broader categories in your model. For example, all accounts related to “revenue” are grouped together under a revenue category, while all “expenses” might be rolled up into an operating expense section.
2. Account Roll-Ups:
In complex organizations, there may be multiple levels of roll-ups. For example, departmental expenses might be rolled up into division expenses, which are further rolled into company-wide operating expenses. A chart map facilitates this hierarchical grouping.
3. Customization for Reporting Needs:
Different stakeholders might have different reporting needs. A CFO might want to see very high-level summaries, while an asset manager may need detailed breakdowns. A good chart map allows for both granular and high-level views by setting up categories that can expand or collapse depending on the reporting context.
Benefits of Using a Chart Map to Model Commercial Real Estate
1. Improved Data Accuracy:
By mapping data to the correct accounts and ensuring consistent treatment of debits and credits, a chart map reduces the chance of errors when aggregating data from various sources. This is particularly important when dealing with financial data from accounting systems, where misclassifications can lead to inaccurate reporting.
2. Streamlined Reporting:
A chart map simplifies the process of generating reports by allowing the model to automatically roll up account balances into the necessary categories. This saves time and ensures consistency in how data is presented.
3. Easier Auditing and Tracking:
Because data flows through clearly defined categories, it is easier to trace how individual figures in a model are calculated. This improves transparency and makes it simpler for others (or future you) to audit or adjust the model.
4. Flexibility for Scenario Analysis:
By setting up categories and account groupings ahead of time, you can more easily run sensitivity analyses or alternative scenarios without needing to restructure your data every time. For example, you can quickly see how a change in operating expenses affects your forecasted returns by adjusting the relevant category in the chart map.
A chart map is an essential tool for organizing financial data in a model, ensuring consistency and accuracy in reporting. It simplifies the process of rolling up detailed financial data into understandable categories, handles accounting complexities, and improves the flexibility of the model for analysis. Whether you’re building a model for commercial real estate or another industry, a well-designed chart map enhances both the model’s functionality and its usability.
Key Dates in Commercial Real Estate Models
Key dates in financial modeling, particularly for commercial real estate, are critical reference points that determine how different sets of data, such as actual and forecasted cash flows, are combined and analyzed. These dates define the timeline of an asset’s life, from acquisition through operation and, potentially, to disposition. They allow you to properly align historical (actual) performance data with projected (forecasted) performance and ensure accurate financial analysis.
Importance of Key Dates in Commercial Real Estate Models
In commercial real estate modeling, key dates help you accurately combine historical and forecasted data. They allow you to:
- Measure the actual performance of an asset over time.
- Project future performance based on the most recent data available.
- Run sensitivity analyses around different hold periods or exit strategies.
- Analyze cash flow and returns over the entire asset lifecycle, from acquisition to sale.
Without key dates properly set, cash flow timelines may become disjointed, resulting in misleading conclusions about the asset’s performance or potential.
Types of Key Dates in Commercial Real Estate Models
1. Acquisition Date:
- This is the date the property was acquired, marking the start of your investment’s life. It is the date from which cash flows (both actual and forecasted) are measured.
- All returns are calculated relative to this date. For example, the internal rate of return (IRR) for an asset would be measured from the acquisition date onward.
2. Actuals Through Date:
- This is the most recent date up to which you have actual performance data (e.g., actual cash flows, rent collections, operating expenses). The data up to this point represents the real financial performance of the asset.
- This date acts as the cutoff between historical and forecasted cash flows. It is critical because it ensures that historical (actual) data is accurately reflected up to the most current period available before any forecasting begins.
3. Forecast Start Date:
- This is the date when projected cash flows begin. It generally starts the day after the “Actuals Through Date”.
- After this point, you switch from relying on historical data to making assumptions or projections about future performance based on factors like market conditions, lease expirations, or planned capital improvements.
4. Disposition (Sale) Date:
- The sale date, also known as the “exit” or “disposition” date, marks the end of the investment period. It is when the asset is projected to be sold, and final cash flows (such as proceeds from the sale) are realized.
- The sale date can be hypothetical in cases where you’re running various exit scenarios, such as a 5-year hold versus a 7-year hold. The cash flow and return metrics (IRR, equity multiple) depend heavily on this exit date, as the timing of the sale can dramatically affect returns.
5. Loan Start and Maturity Dates:
- If debt financing is involved, these dates are important for determining loan amortization schedules and interest payments.
- The loan start date coincides with the acquisition or refinancing date, while the maturity date will affect when balloon payments or loan renewals need to be considered.
Key Dates in Combination with Commercial Property Cash Flows
Key dates also interact with the cash flows to make sure the model correctly allocates the timing of contributions and distributions:
- Contributions: These cash inflows typically occur at or near the Acquisition Date, when equity and debt are contributed to purchase the property.
- Distributions: These occur periodically during the holding period and at the Disposition Date, when the proceeds from the sale of the asset are distributed back to the investors.
Impact of Key Dates on Financial Metrics
1. IRR (Internal Rate of Return):
- This performance metric is highly sensitive to the timing of cash flows. The acquisition, forecast start, and disposition dates are crucial for calculating IRR. A later exit date, for instance, might reduce the IRR because the final cash flow (sale proceeds) is pushed further into the future.
2. Equity Multiple:
- The equity multiple is less sensitive to the timing of cash flows compared to the IRR, but key dates still matter, particularly for understanding when the bulk of returns (via distributions or sale proceeds) will be realized.
3. Net Present Value (NPV):
- Like the IRR, the NPV of an investment depends on the dates at which cash flows occur. The sooner cash is returned, the higher the NPV, so adjusting the Actuals Through Date or Disposition Date can have a significant impact on this metric.
Key dates are essential for building accurate financial models, as they ensure the proper alignment of historical and projected data. They play a crucial role in determining how cash flows are structured, how returns are calculated, and how sensitivity analyses can be conducted. By carefully considering and integrating these dates into your model, you can produce a more reliable, flexible, and transparent analysis of your real estate investments.
Successful Commercial Real Estate Investing
Integrating historical and forecast financial data is essential for evaluating an asset’s performance and for assessing underwriting accuracy. A thorough understanding of both past performance and future projections is key to successful commercial real estate investing. By incorporating source data, a chart map, and integrated cash flows, you can ensure a reusable and accurate methodology for your organization.
Best Practices for Modeling Commercial Real Estate in Excel
Finally, here are a few reminders about Excel modeling best practices to keep your models flexible and clean:
- Functional: The model should work and be usable by others within your organization. It sounds obvious, but it isn’t always easy.
- Transparent: Use best practices for labeling, formatting, and file setup. Colored fonts and cell fills are considered best practices.
- Auditable: Data flows should be logical and easy to follow. Ideally, data should flow from sources and inputs to calculations, reducing the need to jump back and forth between tabs.
- Efficient: Strike a balance between calculation speed and formula complexity.
More On Financial Modeling for Commercial Real Estate
If you’d like more information on financial modeling for commercial real estate, including some expert tips, actionable insights and proven best practices, there are three more posts on financial modeling in our blog that might interest you. The topics are:
- Argus Enterprise Best Practices Part 1: Modeling Market Rent Inflation
- Argus Enterprise Best Practices Part 2: Modeling General Vacancy
- One Simple Tip to Dramatically Improve Your Excel Models
If you’re looking for help modeling a commercial real estate project, Realogic offers a wide range of financial modeling services. Our expert, experienced team can model any type of asset or transaction in your choice of modeling platform and do it quickly and accurately.
Or, if you prefer to model your projects yourself, we offer a suite of powerful, sophisticated off-the-shelf Excel models for commercial real estate development and acquisition. For more information, visit the built Excel models page on our website. Or, to see our development model in action, watch Part 1 or Part 2 of our video product tour.
About The Author
Jim Pettinger is CEO of Realogic. He has worked in commercial real estate for 32 years and is an expert in financial modeling for real estate as well as Argus Enterprise and Excel. He has extensive experience in many facets of commercial real estate, including underwriting, due diligence, lease administration, lease abstraction, budgeting and closing support. In 2025, Jim was inducted into the Midwest Commercial Real Estate Hall of Fame for his exemplary leadership skills, long list of career achievements, long-time support of and advocacy for the industry and his involvement in his local community. In 2024, the authoritative commercial real estate publication GlobeSt. named him one of CRE’s Best Bosses and Crain’s Chicago Business included Jim on its list of CRE Notables. You can reach Jim at jpettinger@realogicinc.com.


